Work with metrics over time
Once generated via the ValidMind Library, view and add metrics over time to your ongoing monitoring reports in the ValidMind Platform.
Metrics over time refers to the continued monitoring of a record’s performance once it is deployed. Tracking how a record, such as a model, performs as new data is introduced or conditions change ensures that it remains accurate and reliable in real-world environments where data distributions or market conditions shift.
- Record performance is determined by continuously measuring metrics and comparing them over time to detect degradation, bias, or shifts in the record’s output.
- Performance data is collected and tracked over time, often using a rolling window approach or real-time monitoring tools with the same metrics used in testing, but observed across different periods.
- Continuous tracking helps to identify if and when a record needs to be recalibrated, retrained, or even replaced due to performance deterioration or changing conditions.
Prerequisites
Add metrics over time
In the left sidebar, click Inventory.
Select a record or find your record by applying a filter or searching for it.4
In the left sidebar that appears for your record, click Documents and select the Latest tab.5
Select a Monitoring type file.6
Click on a section header to expand that section and add content.
Hover your mouse over the space where you want your new block to go until a horizontal line with a sign appears that indicates you can insert a new block:

Adding a content block in the UI Click and then select Metric Over Time7 under From Library.
Select metric over time results:
- Choose from available VM Library (out-of-the-box) or Custom tests under Metric Over Time in the left sidebar of the test selection modal.
- Use Search by name on the top-left to locate specific metric results.
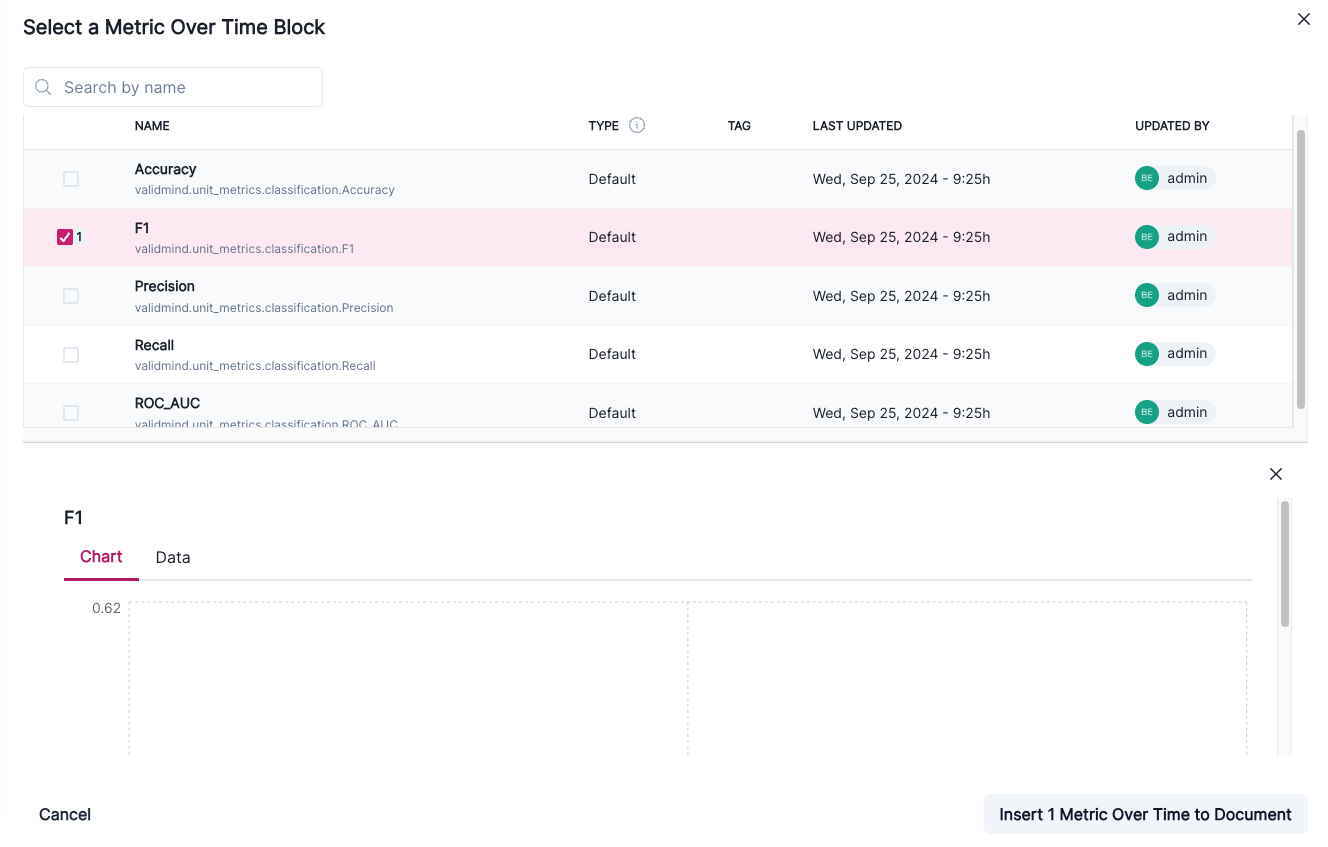
Metric Over Time blocks that have been selected for insertion To preview what is included in a metric, click on it. By default, the actively selected metric is previewed.
Click Insert # Metric(s) Over Time to Document when you are ready.
After inserting the metrics into your document, review the data to confirm that it is accurate and relevant.
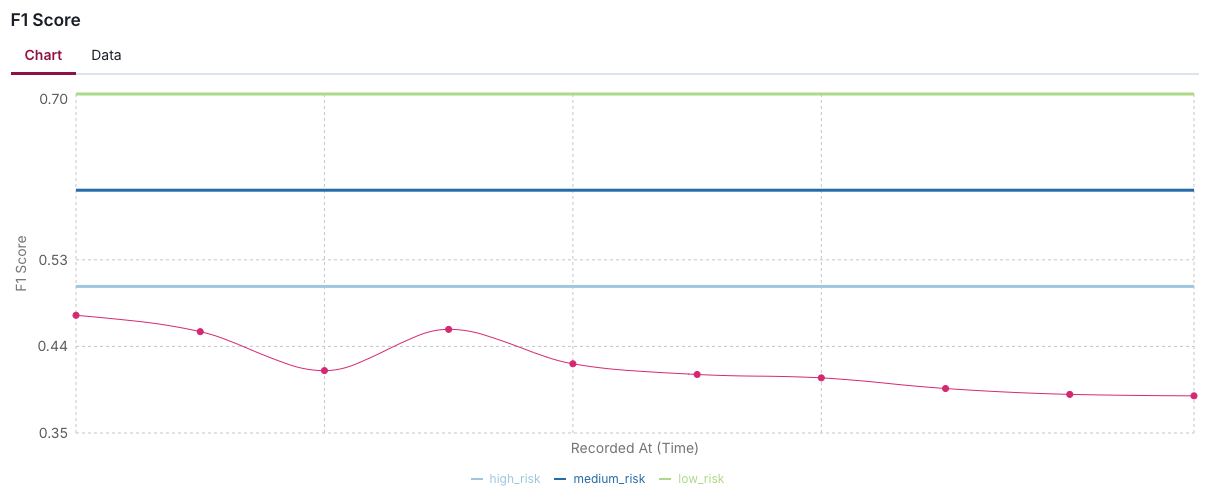
Example F1 Score — Metric Over Time visualization
Add integration metrics
You can add metrics from external integrations such as Amazon Bedrock directly to your monitoring documents. This feature enables you to track evaluation results from Bedrock agents alongside your other metrics.
In the left sidebar, click Inventory.
Select a record or find your record by applying a filter or searching for it.9
In the left sidebar, click Monitoring to open the monitoring report.
Hover your mouse over the space where you want your new block to go until a horizontal line with a sign appears.
Click and then select Metric Over Time.
In the modal that opens, select the From Integration tab.
Select your integration under Integration Source, then choose from the Evaluators list — such as Goal Success Rate, Correctness, or Helpfulness.
Select one or more evaluation metrics to add. For each metric, you can optionally configure:
- Threshold (lower) — Set a lower threshold value to flag when metrics fall below acceptable limits.
- Threshold (upper) — Set an upper threshold value to flag when metrics exceed acceptable limits.
- Time Range — Define the time range for querying metric data. Choose to inherit from the document, use a relative preset, or specify a custom date range.
Click Insert # Metric(s) Over Time to Document when you are ready.
After the metrics sync, data from the integration appears in your document alongside any metrics logged via the ValidMind Library.
Use the global time range
When working with monitoring documents that contain multiple time-based metrics, use the global time range to coordinate the time range across all relevant content.
Navigate to a monitoring document with metrics over time.
Locate the time range button at the top of the document.
Select the desired time range from the available options:
- All Time — Show all available data
- Relative presets (Last 7 days, Last 30 days, etc.)
- Custom range — Specify exact start and end dates
The selected time range applies to all metrics in the document that support time-based filtering, providing a consistent view of your record’s performance over the chosen period. This setting is only visible to you and does not affect other users.
View metric over time metadata
After you have added metrics over time to your document, you can view the following information attached to the result:
- Date and time the metric was recorded
- Who updated the metric
- The numeric value of the metric
- The metric’s thresholds
- Any additional parameters
In the left sidebar, click Inventory.
Select a record or find your record by applying a filter or searching for it.10
In the left sidebar that appears for your record, click Documents and select the Latest tab.11
Select a Monitoring type file.12
Locate the metric whose metadata you want to view.
Under the metric’s name, click on Data tab.
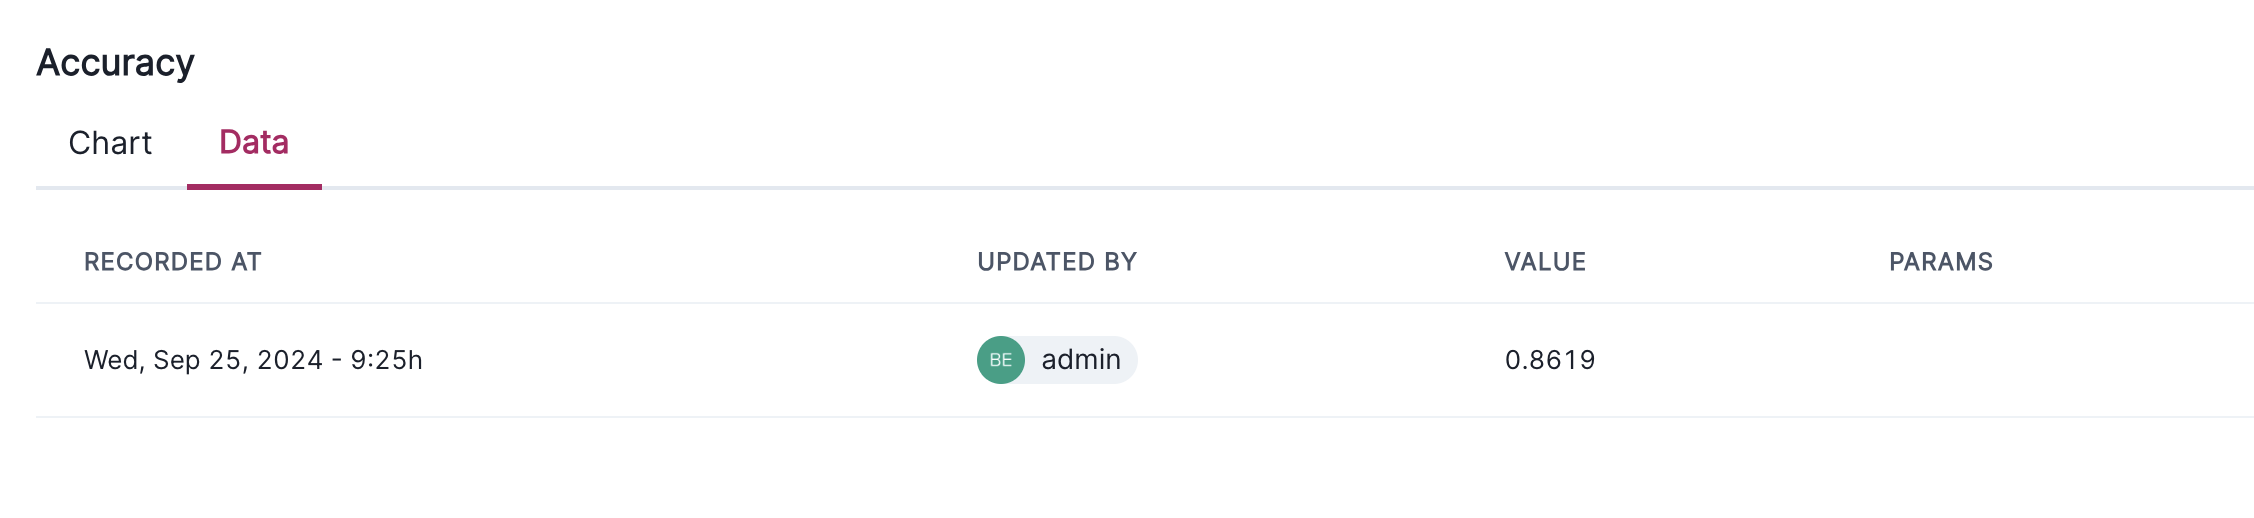
Example Data tab within a Metric Over Time