Add date and datetime support for analytics filters

frontend
25.04
highlight
enhancement
Published

April 10, 2025

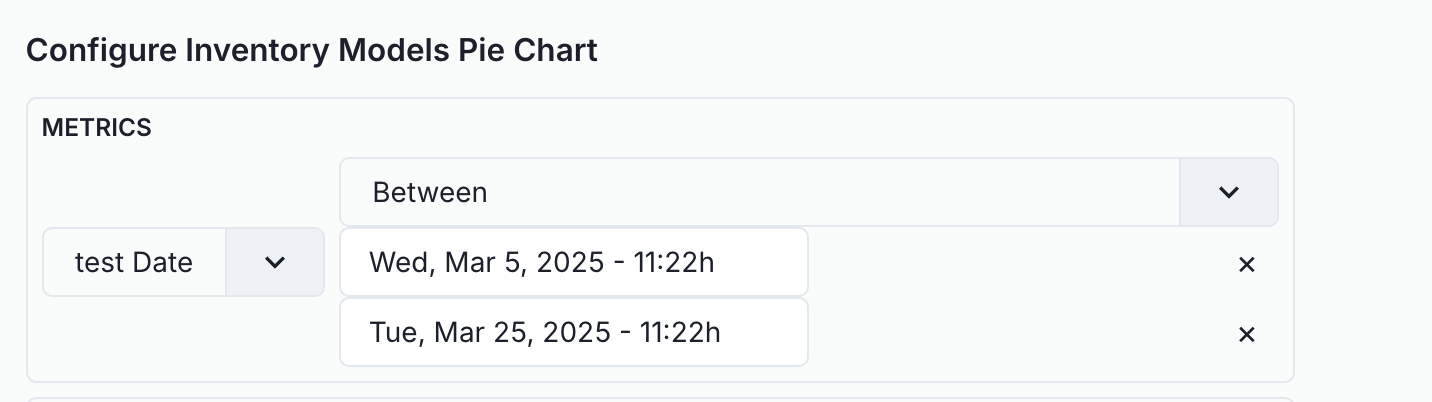
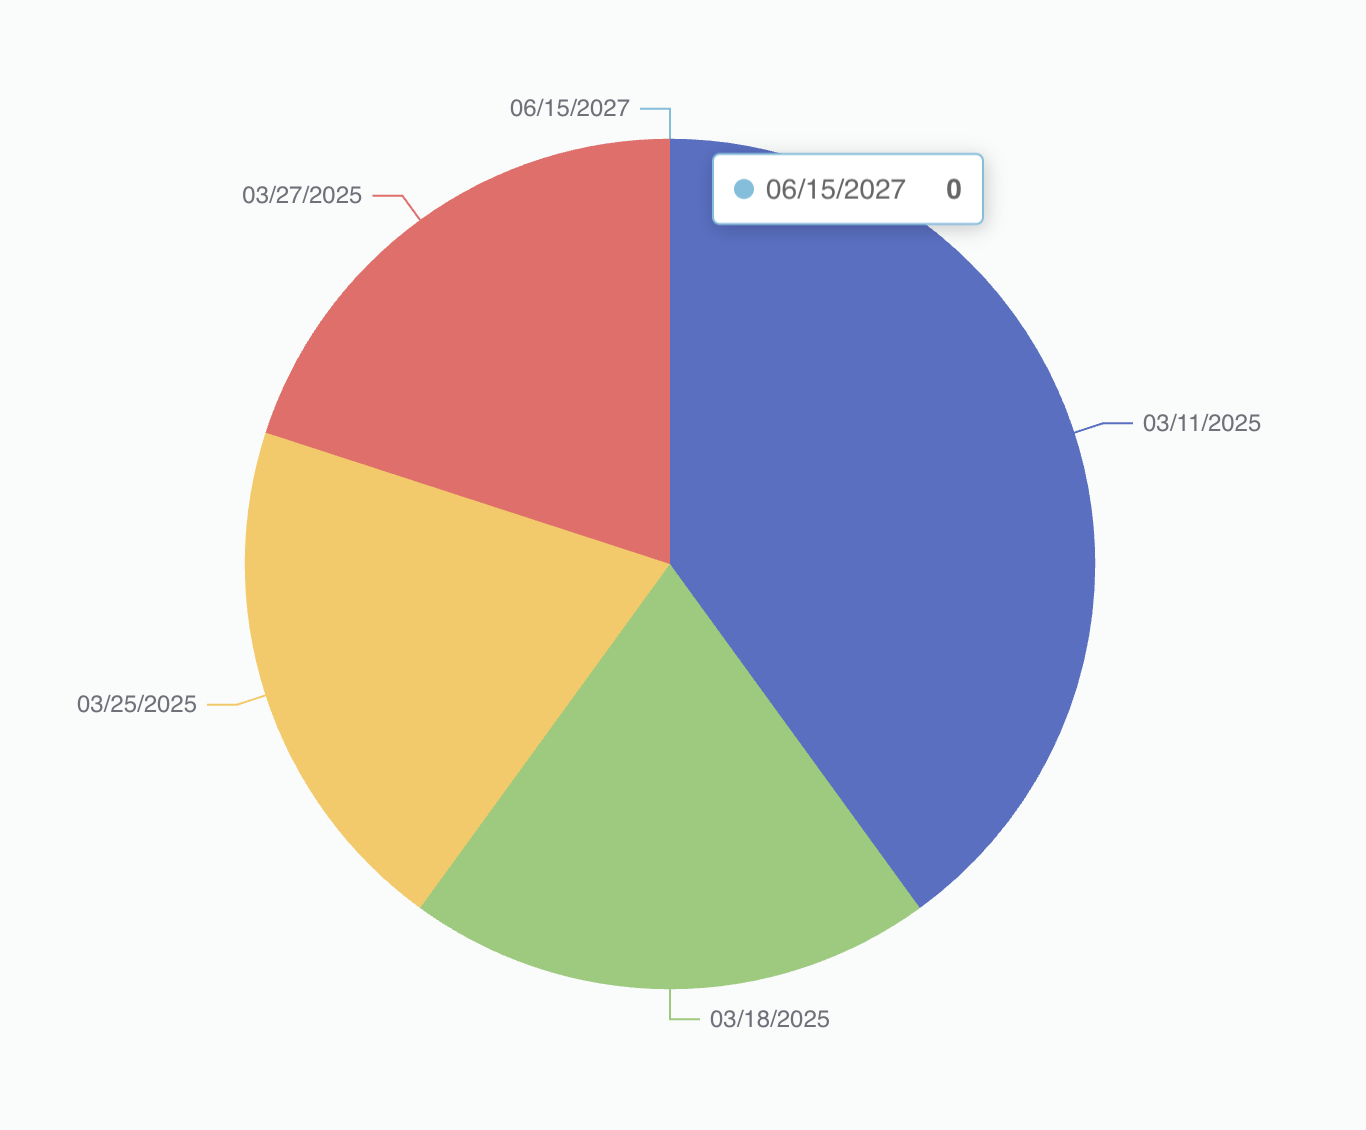
This update enhances the visualization modal’s filtering interface by introducing a custom value editor component specifically designed for date inputs. You can now utilize Date and Datetime types in both Grouping and Metrics, offering greater flexibility in data organization. Additionally, we have added support for Between and Not Between filters within Metrics, enabling more precise data filtering.

A pie chart with four colored segments representing different dates. The blue segment, labeled 06/15/2027, is highlighted with a tooltip showing the date and a value of 0. The red segment is labeled 03/27/2025, the yellow segment is labeled 03/25/2025, and the green segment is labeled 03/18/2025. Each segment has a line extending outward to its label. The chart is set against a light gray background.

A user interface for configuring inventory models pie chart is displayed. At the top, there is a section titled Metrics. Below it, there is a dropdown menu labeled test Date with a downward arrow on the left. To the right, there is a selection labeled Between with a dropdown arrow. Two date and time entries are listed below: Wed, Mar 5, 2025 - 11:22h and Tue, Mar 25, 2025 - 11:22h, each with an x button on the right for removal.